Analysis EUR/USD 5M
The EUR/USD currency pair on Wednesday resumed its downward movement, failing to overcome the very first significant resistance on its way north. Thus, the downtrend persists; the pair cannot even correct and has been falling for more than three weeks in a row. In our view, it is already obvious to everyone that the problem does not lie in Federal Reserve monetary policy. Only this week several Fed representatives indicated that the tightening process will continue, but the central bank may conduct at most one more rate hike in total. And this event is unlikely to happen in October. Simply put, the Fed is not set on aggressive tightening. Yet over the last three weeks, the market bought the dollar as if the Fed would raise interest rates by 2 points or more. And even now, as "hawkish" sentiment in the market has somewhat faded, the dollar continues to appreciate. The market does not perceive or account for all other factors. There are not even technical corrections because no one in the market is taking profits on short positions. This indicates that traders believe the US currency will continue to grow. As we said earlier, we are seeing only inertial and illogical movement.
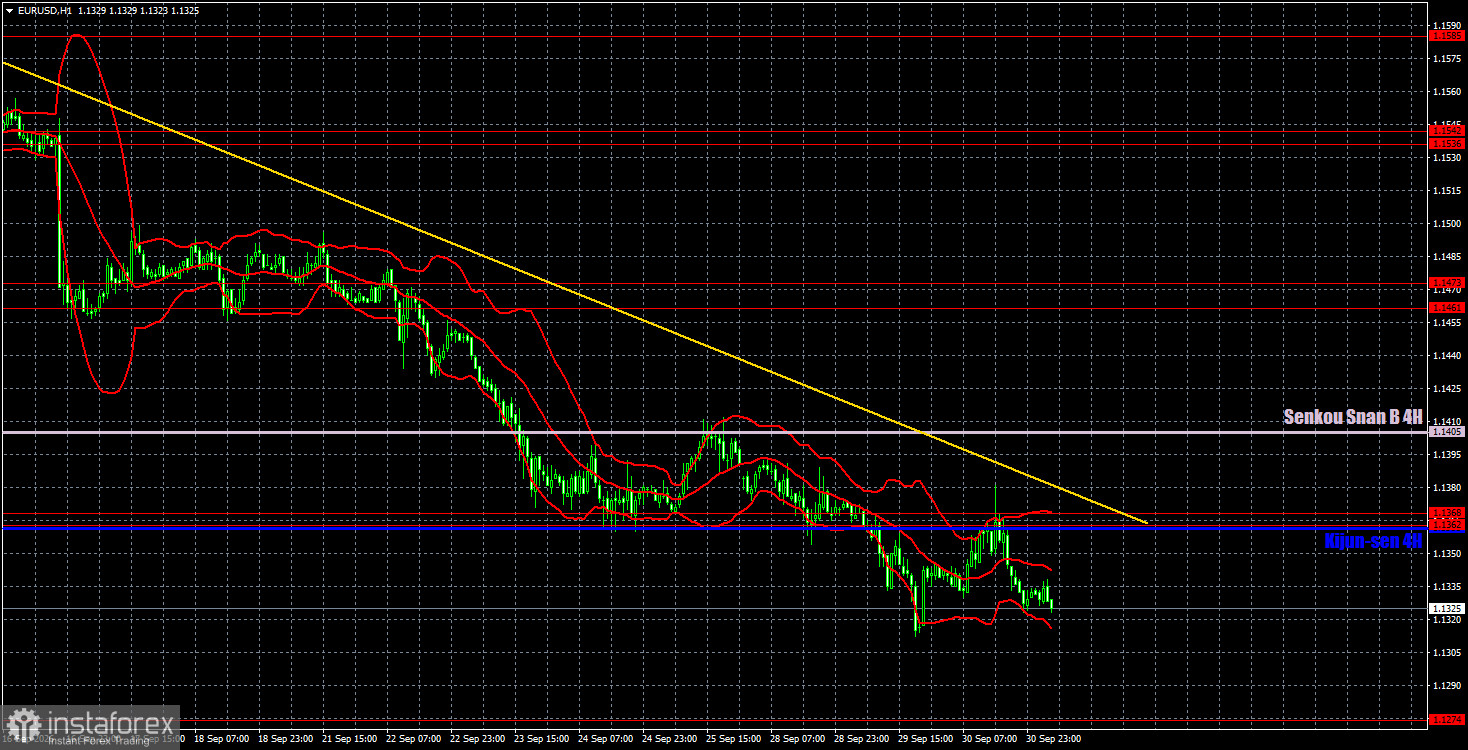
Technically, the downtrend continues to form. The market continues to price in a future Fed rate hike, which already looks simply absurd in the fourth week of this pricing-in. The trendline remains relevant, and price is below the Ichimoku indicator lines, so technically, the pair's decline is entirely logical. But only on the hourly TF. On the weekly TF, an uptrend remains.
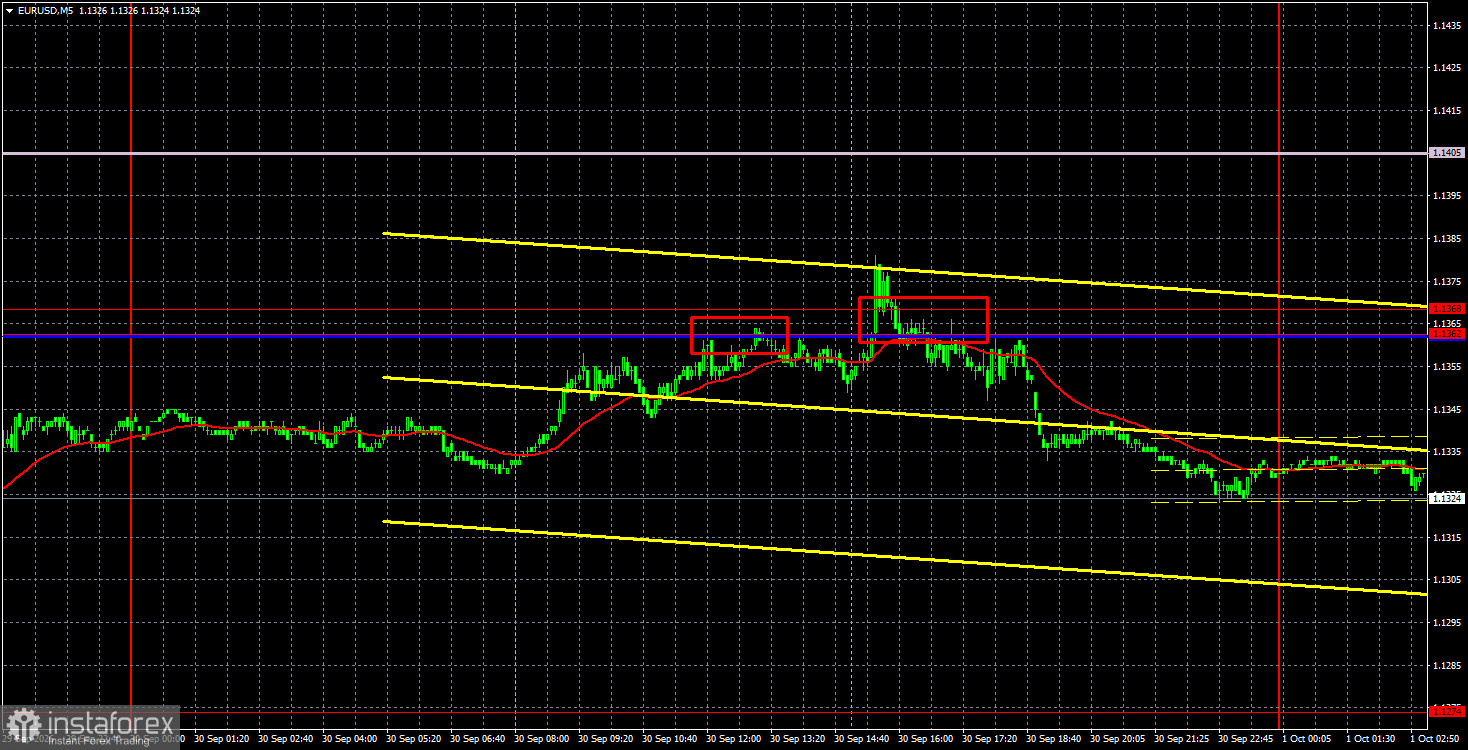
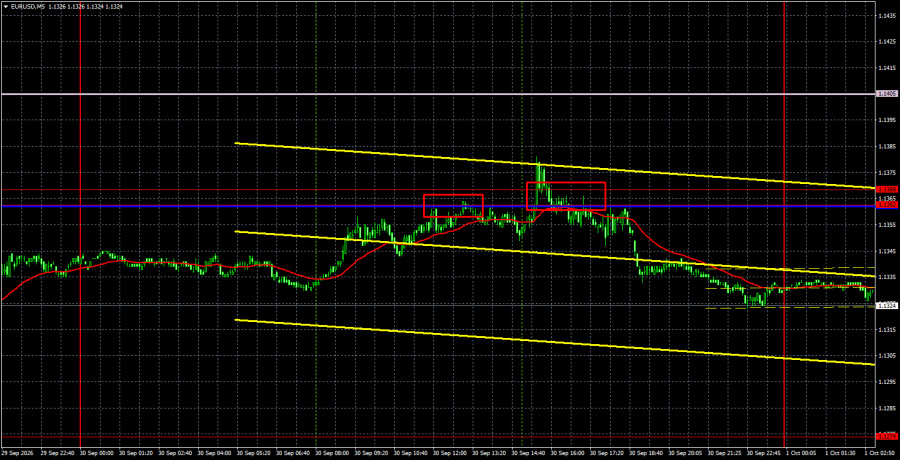
On the 5-minute TF, two trading signals were formed on Wednesday. Price bounced twice from the 1.1362-1.1368 area, allowing traders to open short positions. We note that, influenced by macroeconomic data, the signals were not the most accurate, but overall the dollar continues to strengthen under any circumstances.
COT Report
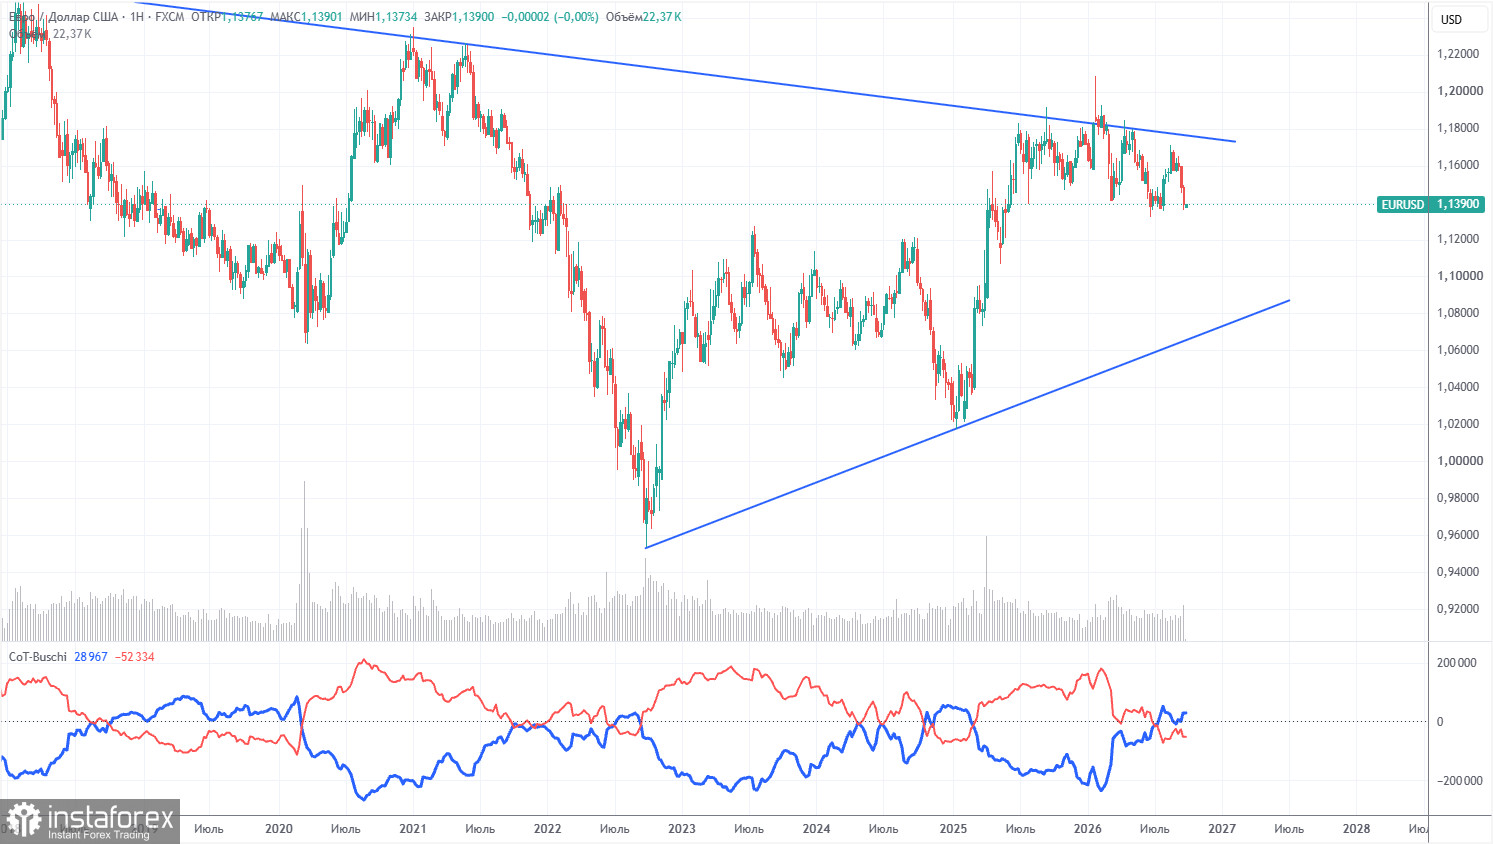
The latest COT report is dated September 22. On the weekly TF chart, it is clear that non-commercial traders' net position remains "bearish" and has significantly decreased in 2026 due to geopolitical events. Traders have been getting rid of the euro in favor of the US dollar over the past six months. Donald Trump's policies have not changed, but the dollar has, for a time, acted as a "reserve currency."
However, we still do not see any fundamental factors for further strengthening of the US currency. The war in the Middle East made the dollar temporarily super-attractive, and the Fed's monetary-policy stance surprised the dollar for the second time this year. In the long term, the euro can fall even to 1.08$ (the trendline), but the uptrend will remain relevant. And during the recent months of dollar gains the pair did not get very close to that line.
The positions of the red and blue indicator lines indicate approximate parity between bulls and bears. During the last reporting week, long positions in the "Non-commercial" group rose by 11,700, while shorts increased by 37,000. Accordingly, the net position fell by 25,300 contracts over the week.
Analysis EUR/USD 1H
On the hourly timeframe, EUR/USD continues to form a downward trend, and the Fed strongly aided the development of the southbound move. The European Central Bank should have supported the euro, having already raised rates twice in 2026, but the market now sees no factors supporting the euro. Thus, the dollar effectively formed a trend out of nowhere, and market sentiment may remain "bearish" going forward.
For October 1 we highlight the following levels for trading — 1.1234, 1.1274, 1.1362-1.1368, 1.1461-1.1473, 1.1536-1.1542, 1.1585, 1.1657-1.1665, 1.1750-1.1760, as well as the Senkou Span B line (1.1405) and Kijun-sen (1.1361). The Ichimoku indicator lines may move during the day, so account for this when determining trading signals. Do not forget to move the Stop Loss to breakeven if the price has moved 15 pips in the correct direction. This will protect against possible losses if the signal turns out to be false.
On Thursday, the EU will publish an unemployment report, and ECB President Christine Lagarde will give another speech. In the US today — initial jobless claims and the ISM manufacturing activity index. We believe the ISM index may influence traders' sentiment, but it will remain "bearish," at least until Friday.
Brief summary of the above analysis:
Traders can consider targets for short positions near 1.1274 after a rebound from the 1.1362-1.1368 area. If the trendline is breached, consider these targets for long positions: 1.1504 and 1.1461.
Explanations for the illustrations:
- Price support and resistance levels (resistance/support) — thick red lines around which movement may end. They are not sources of trading signals.
- Kijun-sen and Senkou Span B lines — Ichimoku indicator lines transferred to the hourly timeframe from the 4-hour timeframe. They are strong lines.
- Extreme levels — thin red lines from which the price previously bounced. They are sources of trading signals.
- Yellow lines — trendlines, trend channels, and any other technical patterns.
- Indicator 1 on the COT charts — the size of the net position of each trader category.