Bitcoin has ended its local flat and broken out into wider territory. However, there is still no confidence that the leading cryptocurrency will continue to rise. The current rise on the daily TF still looks like an unfounded pump or manipulation by large players aimed at pushing as many traders as possible into long positions, only to then crash the price. Essentially, price has left the sideways channel, but it may still be an abnormal and deep deviation. Therefore, we still consider the probability of a new fall to the lower boundary of the sideways channel higher than that of further growth.
It is also worth noting that we are not the only ones doubting further growth of "digital gold." For example, CryptoQuant stated that the current "bullish" impulse may already be over. Experts noted that almost all technical indicators are in states of "bearish" divergences or strong overbought conditions. Of course, technical indicators only show what is happening in the market, not move the price, but they also warn that further growth is unlikely at this time. Bitcoin is at price levels where a large number of coins held by long-term owners have accumulated. Thus, for further growth, new investments are again required.
Investors have also accumulated about $14 billion in unrealized profits, while weekly trading volume on major exchanges has fallen to $2.5 billion. In short, trading volumes are currently extremely low, and such a thin market can react very painfully to any event. For example, profit-taking on a large long position can push Bitcoin down and trigger a wave of Stop-Loss orders. Recall that spot demand for "digital gold" remains low, and most open positions are futures. Futures positions have leverage, which makes any trend unstable and risks provoking mass forced liquidations.
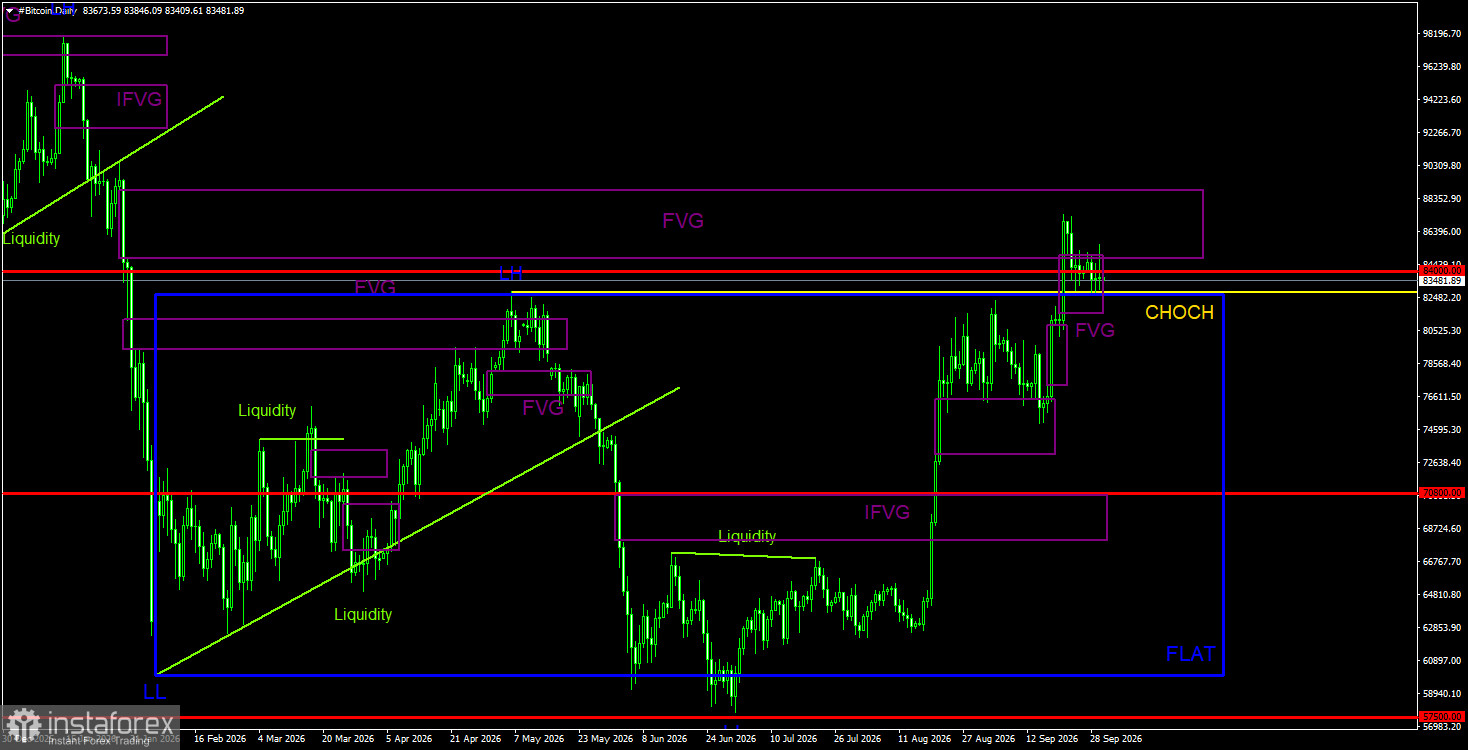
General Picture of BTC/USD on 1D
On the daily TF, the downward trend structure is broken, so "digital gold" has most likely moved into a new "bull" trend. At the moment, the price has filled the bearish FVG from the previous trend, so we expect a downward correction. We note that the latest Bitcoin rise, as well as the rise in mid-August, bears all the signs of a pump. And the breakout from the sideways channel $60,000 - $82,500 may still be a deviation. Support is currently provided by a bullish FVG in the $81,500 - $89,000 range; however, so far there has been no reaction to this pattern. Bitcoin is increasingly approaching a correction.
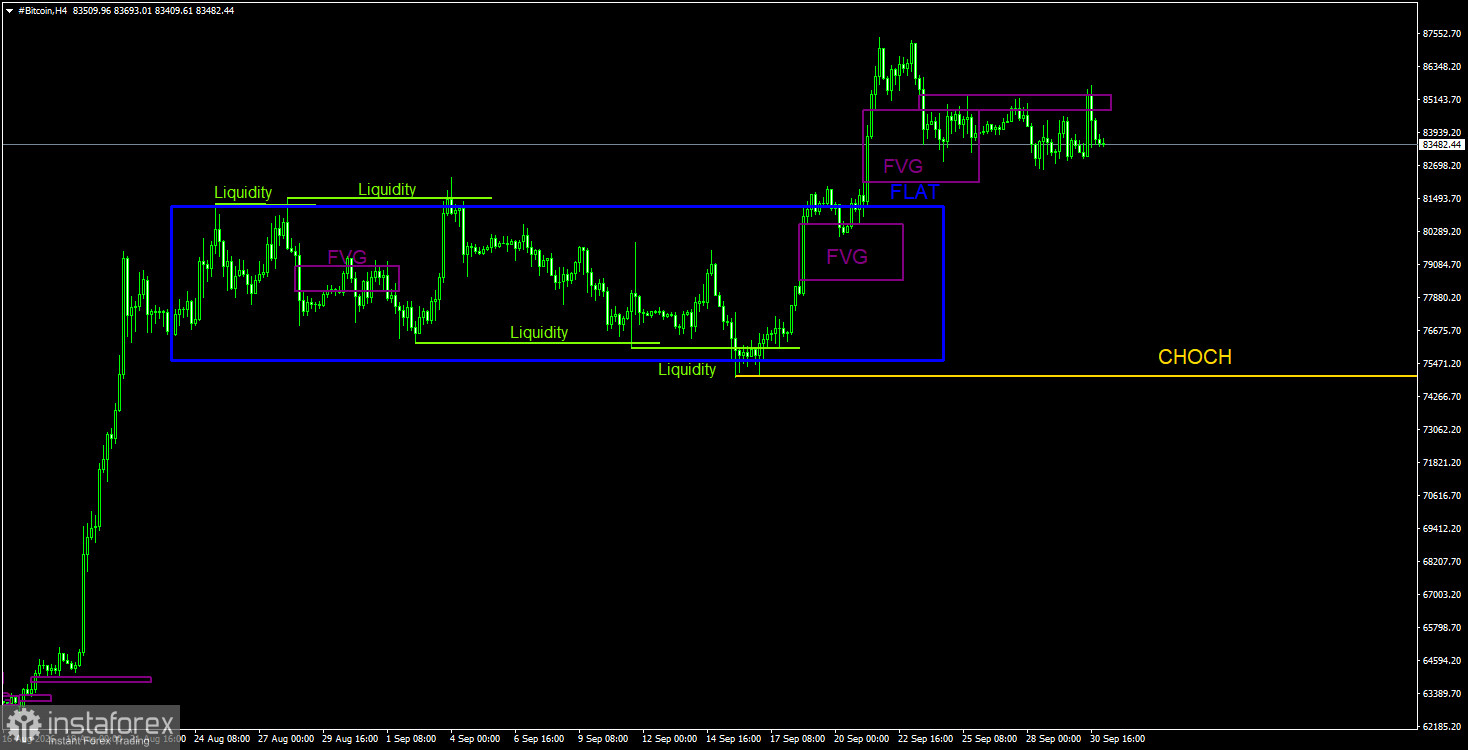
General Picture of BTC/USD on 4H
On the 4-hour timeframe, Bitcoin left the bounds of the sideways channel. Within that channel, four deviations were formed, the last two being bullish. Thus, traders could have played the last move from the lower boundary of the channel to the upper one, and now it can be said that the flat is over. From the nearest areas of interest, we can only highlight the last bullish FVG; however, there was no reaction to it. A bearish FVG was also formed, and a reaction to it was received. We believe the decline will continue. The CHOCH trend-break line lies at the 75,000$ level.
Recommendations for trading BTC/USD:
Bitcoin shows all the signs of a new bullish trend. This trend begins, as usual, with a pump that has no clear reason. The Fed has not started cutting rates, and the Clarity Act bill has still not been passed. In the near term on the daily TF, Bitcoin may decline, since the price received a reaction to the bearish FVG. We also draw traders' attention to the fact that the current breakout from the sideways channel on the daily chart may be a deviation. Yes, a deep deviation, but still a deviation. If so, Bitcoin can still drop back to 57,500$. On the 4-hour TF, one can locally consider both long and short positions, but the last relevant pattern is bearish.
Explanations for the illustrations:
- CHOCH – change of character (trend structure break).
- Liquidity – liquidity, Stop Losses, pending orders that market makers use to accumulate their positions.
- FVG – fair value gap (area of price inefficiency). Price moves through such areas very quickly, indicating the absence of one side in the market. Subsequently, price tends to return and receive a reaction from such areas in continuation of the main trend.
- IFVG – inverted fair value gap. After returning to such an area, price does not react but impulsively breaks through, then tests it from the other side.
- OB – order block. The candle on which a market maker opened a position with the aim of taking liquidity to form their own position in the opposite direction.