The EUR/USD currency pair unexpectedly reversed upward on Wednesday, showing a modest rise. But even that rise surprised many traders, since the pair had been falling for three weeks in a row. The US currency's fall was driven by a speech by one of the Federal Reserve's FOMC members, John Williams. According to him, there is no urgency in raising the key rate, and the central bank may conduct at most one more policy tightening before the end of the year. It is worth reminding traders that the last dot plot signaled precisely one rate hike. Not "before the end of the year" as a broad period, but just one. Thus, we saw almost a month-long rise of the US currency based on... one future rate increase.
We recall that the September monetary tightening was already priced in by the market back in the summer, when it repeatedly bought the dollar on speeches by Kevin Warsh. Mr. Warsh several times stated that inflation in the US remains too high and must be addressed. Naturally, each time the market rushed to buy the dollar, expecting the most "hawkish" measures possible. After three full weeks of the US currency's rise, one can confidently say that if during all that time the market was indeed pricing in future Fed tightening, it again embedded into prices the rate level it wants to see, not a realistic one.
However, we still doubt that the dollar's strength lies in Fed monetary policy. Even if the market expected three more rounds of tightening, don't leading global experts, economists, and traders understand that you shouldn't rely on such a long-term outlook? Energy prices can change at any moment; the Middle East conflict may or may not end at any moment. In other words, there were no guarantees that the Fed would still be raising the key rate six months from now.
By the way, one of the Fed's key inflation measures, the PCE index for August, was 3.4%, contrary to forecasts of 3.7%. Thus, the Fed's favorite inflation indicator did not change in August. Neither did core inflation. In our view, the Fed has no grounds for further immediate monetary tightening. As before, we believe that, first, the market has greatly overestimated the Fed's capacity to raise rates, and second, the Fed will raise the rate at most two times in total, and next year will begin a cycle of monetary easing.
Therefore, we previously saw no reason for such a strong rise in the US dollar. Now we see them even less. For the second time this year, a "black swan" arrived in the market and provided powerful support to the dollar when no one expected it. But how long will the US currency keep getting this kind of luck? On the weekly timeframe, EUR/USD has been moving sideways for a year.
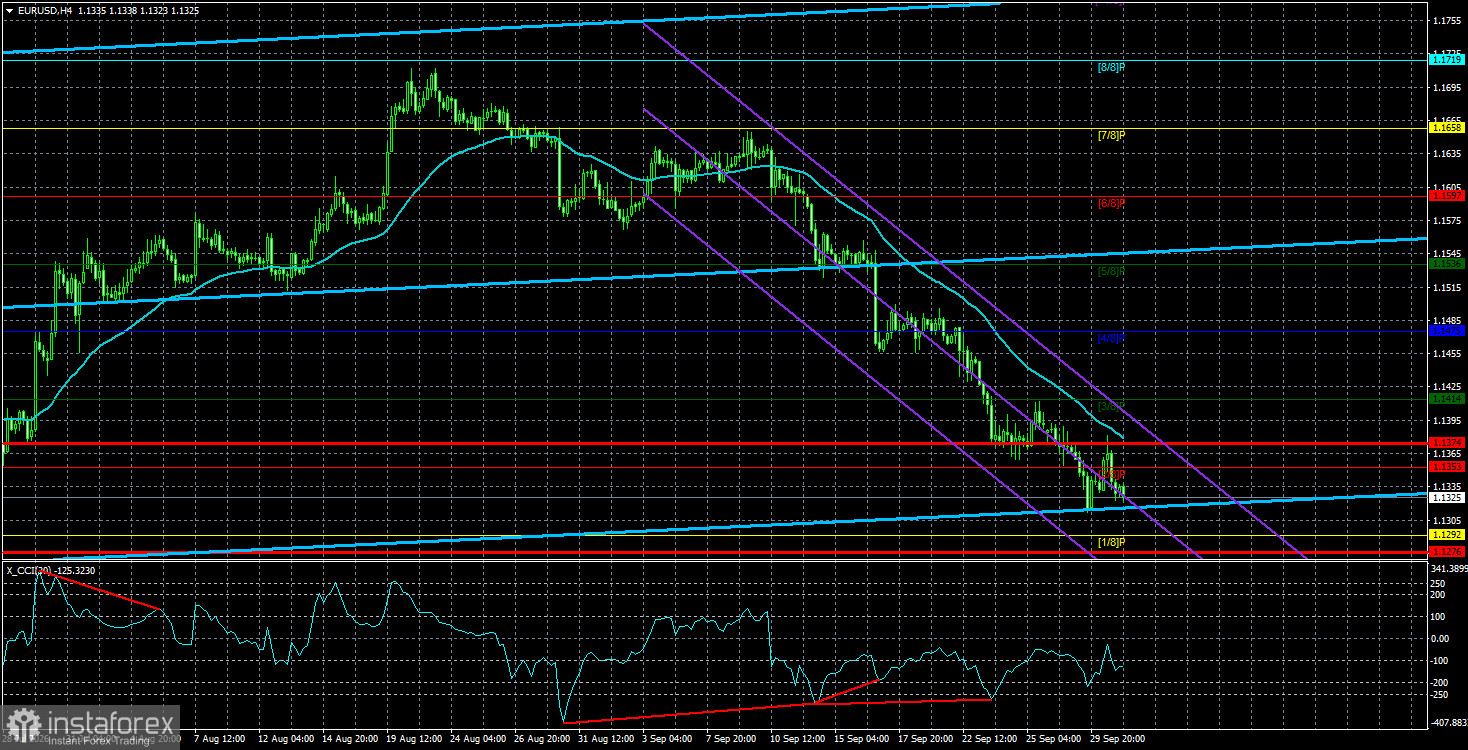
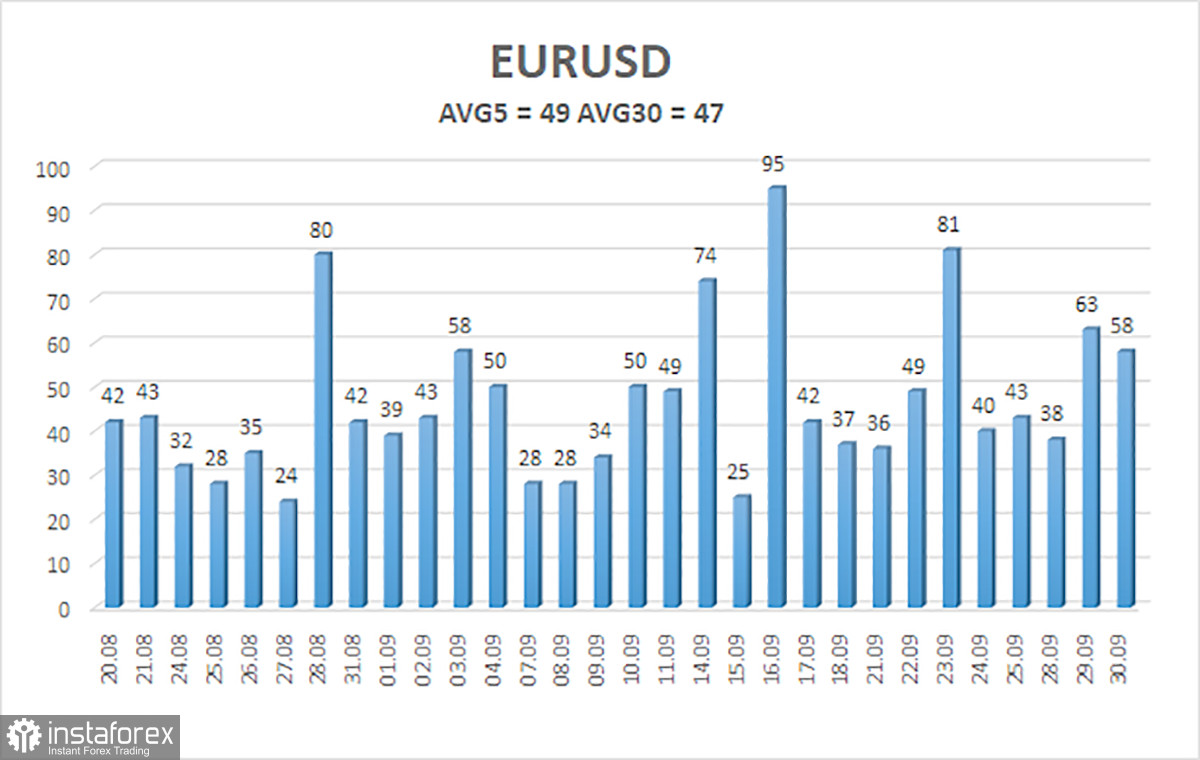
The average volatility of the EUR/USD currency pair over the last 5 trading days as of October 1 is 49 pips and is characterized as "average." We expect the pair to move between 1.1276 and 1.1374 on Thursday. The higher linear regression channel is directed upward, indicating an uptrend. The CCI indicator entered the oversold area three times and formed three "bullish" divergences, which warn of the end of the illogical downtrend. However, the market is not reacting to anything right now.
Nearest support levels:
S1 – 1.1292
S2 – 1.1230
S3 – 1.1169
Nearest resistance levels:
R1 – 1.1353
R2 – 1.1414
R3 – 1.1475
Trade recommendations:
The EUR/USD pair continues to move downward, but we still view the pair's decline as a correction before a new upward trend. The global fundamental background for the dollar remains negative, but in 2026, geopolitical events first, and then the Fed's "hawkish" stance, provided strong support to the US currency. When the price is below the moving average, consider short positions with targets of 1.1292 and 1.1276. Above the moving average line, long positions are relevant with targets of 1.1414 and 1.1475.
Explanations for the illustrations:
- Linear regression channels help determine the current trend. If both are directed the same way, the trend is currently strong.
- The moving average line (settings 20,0, smoothed) defines the short-term tendency and the direction in which trading should be conducted now.
- Murray levels are target levels for moves and corrections.
- Volatility levels (red lines) show the likely price channel the pair will trade in over the next 24 hours, based on current volatility indicators.
- The CCI indicator — entering the oversold area (below -250) or the overbought area (above +250) — signals an imminent trend reversal in the opposite direction.