

empty
02.10.2026 04:46 AM
Overview of the GBP/USD Pair. October 2. The Pound Shows Remarkable Resilience

This image is no longer relevant

The GBP/USD currency pair also fell significantly on Thursday amid current volatility, but overall it has gone several days without making new local lows. One could say the pound is demonstrating greater resilience than the euro. In the EUR/USD piece, and in recent weeks, we repeatedly noted the complete illogicality of the US dollar's rise. Therefore, in essence, analyzing macro reports or fundamental/geopolitical events to find the reason for a move on any given day is meaningless. For example, why did the US currency rise on Thursday if the first important report (the ISM index) was released practically in the evening?

Why has the US dollar been rising for the fourth week in a row if the Federal Reserve raised rates only once and the entire tightening cycle the market priced in back in summer might consist of two hikes? Which the market has already priced in something like ten times... When was the last time a Fed decision or change in the key rate produced a trend lasting three full weeks? And note that alongside the Fed, the European Central Bank is also tightening policy, and soon the Bank of England will join because inflation is rising not only in the US.

The geopolitical backdrop in the Middle East is unchanged, and another failure in negotiations is no longer news. Iran and the US cannot agree on the terms of a deal and a ceasefire, so they may begin and end new rounds of talks every day with nothing changing. And the dollar cannot rise on every failed negotiation, because then, in each new round, it should first fall.

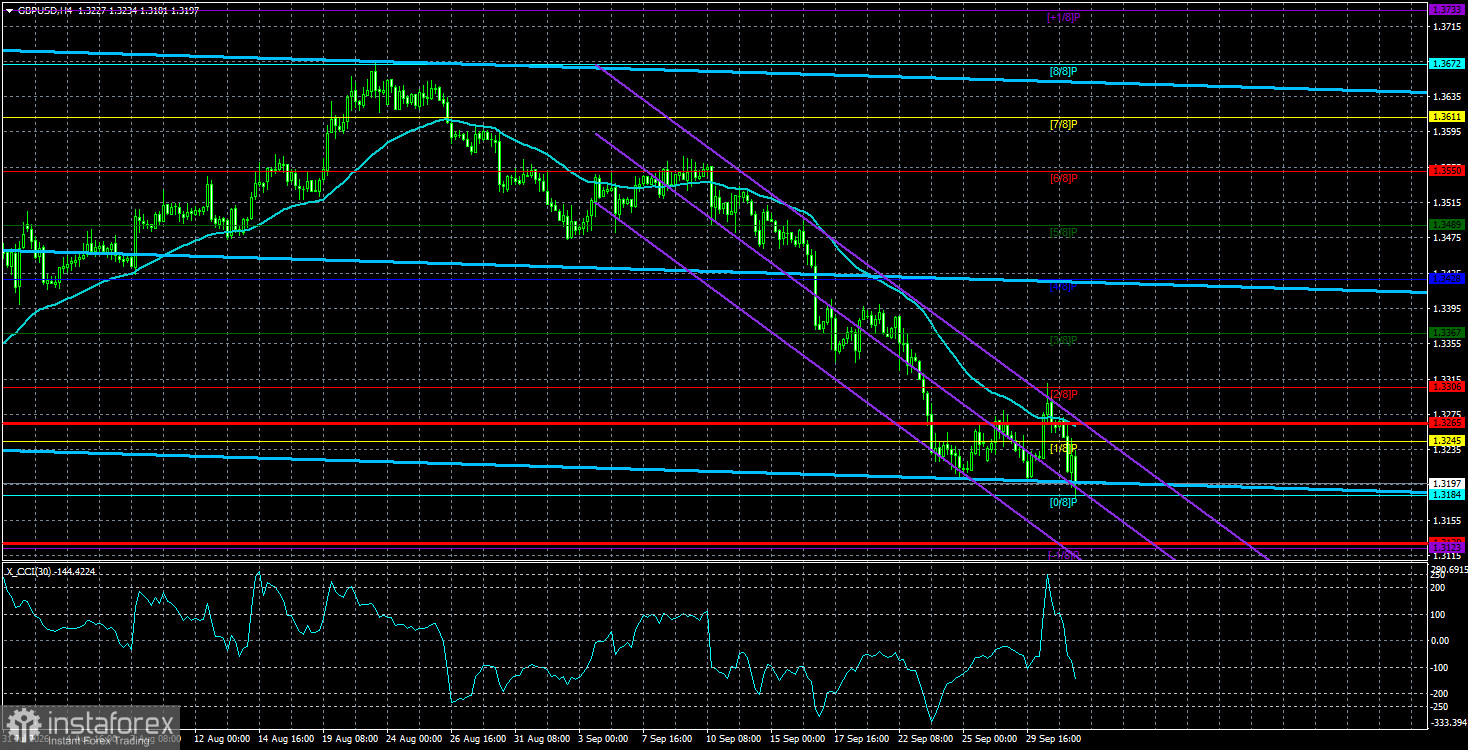
Thus, the nature of the current GBP/USD decline is not fundamental, not macroeconomic, and not geopolitical. The only thing that comes to mind is technical, but even here the picture looks logical only on lower timeframes. A downtrend formed on the lower TFs and has continued with almost no corrections for the fourth week in a row. It's almost a paradise for traders when the price moves in one direction every day. Meanwhile, on higher TFs, GBP/USD has been clearly flat for a year, especially on the weekly chart. Accordingly, first, any move on lower TFs is essentially random, and second, the flat persists, with price sitting near the lower end of the sideways channel 1.3150–1.3780. Thus, we believe analysis should now start from the weekly-TF flat. There is a high probability that a move from the lower boundary of the sideways channel toward the upper boundary will begin. That move will likewise have no obvious reason.

This image is no longer relevant

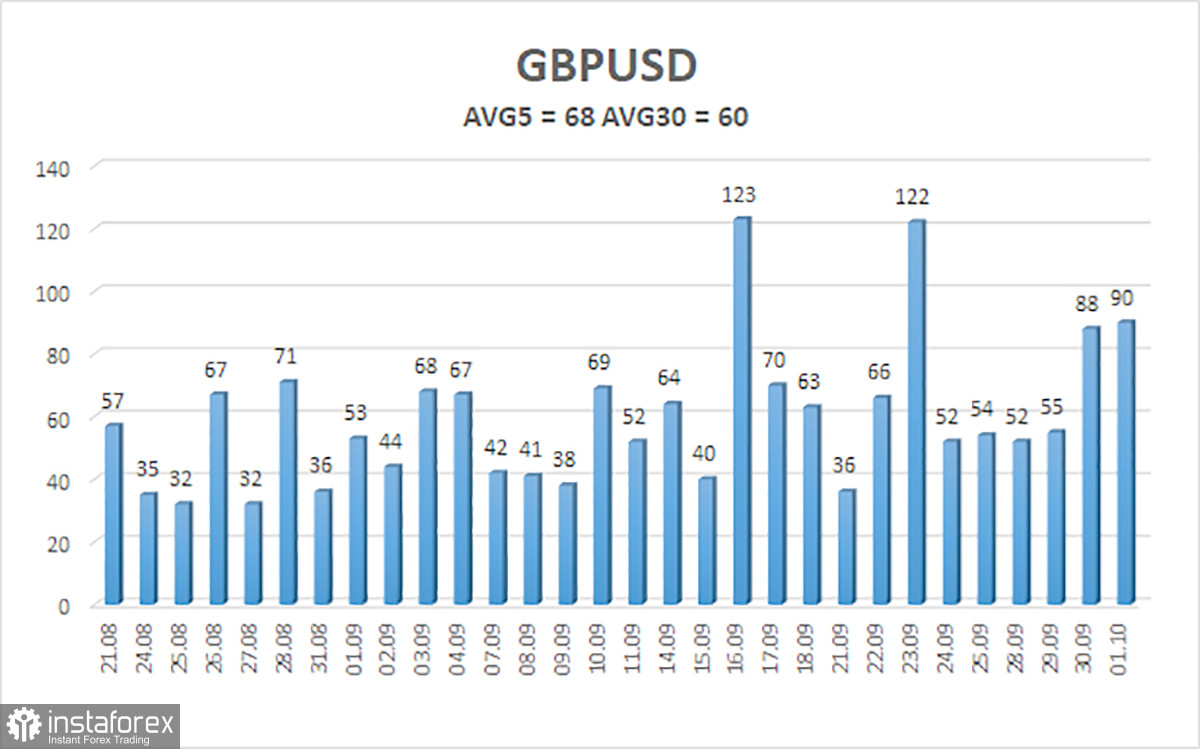
The average volatility of the GBP/USD pair over the last 5 trading days is 68 pips. For the pound/dollar pair, this value is "average." On Friday, October 2, therefore, we expect movement within the range bounded by levels 1.3129 and 1.3265. The higher linear regression channel is directed upward, indicating an uptrend. The CCI indicator has entered the oversold area twice, warning of a possible end to the downward trend.

Nearest support levels:

S1 – 1.3184

S2 – 1.3123

S3 – 1.3062

Nearest resistance levels:

R1 – 1.3245

R2 – 1.3306

R3 – 1.3367

Trade recommendations:

The GBP/USD currency pair continues its illogical downward movement. Donald Trump's policies will continue to put pressure on the US economy, so we do not expect the US dollar to rise in the long term. So far, 2026 has been positive for the dollar due to geopolitics and inflation, which forced capital to flee to safety and the Fed to return to monetary tightening. However, on the weekly TF, a flat range persists between levels 1.3150 and 1.3780 within a four-year uptrend, which allows one to expect growth of the British currency in the medium term. Consider long positions with targets of 1.3367 and 1.3428 when price is above the moving average. When price is below the moving average, you can trade the downside, targeting 1.3130 and 1.3123.

Explanations for the illustrations:

  • Linear regression channels help determine the current trend. If both are directed the same way, the trend is currently strong.
  • The moving average line (settings 20,0, smoothed) defines the short-term tendency and the direction in which trading should be conducted now.
  • Murray levels are target levels for moves and corrections.
  • Volatility levels (red lines) show the likely price channel the pair will trade in over the next 24 hours, based on current volatility indicators.
  • The CCI indicator — entering the oversold area (below -250) or the overbought area (above +250) — signals an imminent trend reversal in the opposite direction.
Gana con los cambios en el valor de las criptomonedas con InstaForex.
Descarga MetaTrader 4 y abre tu primera operación.
  • Grand Choice
    Contest by
    InstaForex
    InstaForex always strives to help you
    fulfill your biggest dreams.
    UNIRSE AL CONCURSO
  • Depósito al azar
    ¡Haga un depósito en su cuenta de $3,000 y obtenga $1000 más!
    ¡En Octubre, sorteamos $1000 dentro de la campaña Depósito afortunado!
    Obtenga la oportunidad de ganar depositando $3,000 en una cuenta de operaciones. Tras haber cumplido esta condición, se convertirá en un participante de la campaña.
    UNIRSE AL CONCURSO
  • Opere de forma inteligente, gane un dispositivo
    Recargue su cuenta con al menos $500, regístrese en el concurso y tenga la oportunidad de ganar dispositivos móviles.
    UNIRSE AL CONCURSO
  • 30% de bonificación
    Reciba un bono del 30% cada vez que recargue su cuenta
    OBTENER BONO

Recommended Stories

¿No puede hablar ahora mismo?
Ingrese su pregunta en el chat.
Widget callback